-
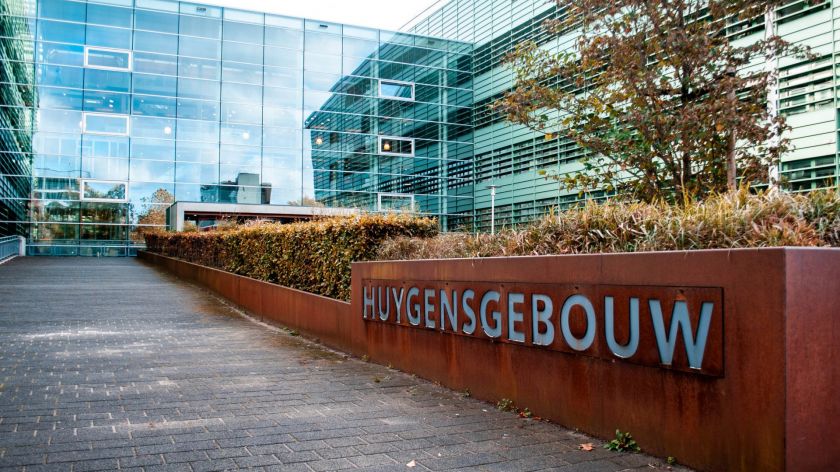 Occupancy rates are measured in the Huygens building, too. Photo: Diede van der Vleuten
With the help of new software, the university wants to get a better idea of the occupancy of eight campus buildings. This is not only useful for scheduling lecture halls, but can also contribute to sustainability on campus, according to employees of Campus & Facilities.
“We are measuring the occupancy rate in this building”, is a message that can be read at various locations across campus. The white signs with red lettering are there because the university has recently purchased a software package that aims to get a better understanding of how crowds are distributed across campus.
Until recently, occupancy counts were still done manually: staff would count in a booklet how many students were in a lecture hall or how many employees were present in a particular wing of a building. However, these manual counts were often snapshots. ‘Think of bad weather or exam periods’, says Koen Fleuren of Campus & Facilities. ‘Then the campus is less busy.’
Campus Wi-Fi
This should now change. Using software from HubStar, the university can map occupancy rates over a long period of time. ‘We have installed the system in eight buildings (see box, ed.) where a lot of teaching takes place, but where there are also study workplaces and offices’, explains René Hagels of Campus & Facilities. ‘In real time, we can see how many people are present. That helps us fine-tune our facilities to the needs.’
‘All data are anonymised and not traceable to individuals or individual offices’
How it works? The software is powered via the so-called Wi-Fi access points. The number of people logged into the campus network system – on eduroam or as guests – is visible in the system. Those not logged into the campus Wi-Fi or those surfing via 4G are not included in the count. The privacy of students and staff is not compromised, Hagels explains. ‘We do not measure per office space but per building section. All data are anonymised and not traceable to individuals or individual offices, so we do not know who is present on campus and who isn’t’, he says.
Cleaning programmes
Hagels opens the software programme that displays floor plans of the eight buildings. If he clicks on a building, he can then choose a particular floor, wing or lecture hall. Both for the whole building, the floor and the hall, the programme displays in percentages and absolute numbers how many people are measured. ‘In the Lecture hall complex, there is a hall with a capacity of 423 people, 11 percent of which is now present’, says Hagels. ‘That may be correct, because right now it is break time.’
According to Hagels, it is interesting to know how students and staff are distributed across the university campus for several reasons. ‘The information the system offers can help with scheduling lecture halls’, he says. ‘It is sometimes said that we have too few halls or that they are too small. With this programme, we can check whether the room supply matches the need. And if someone needs a hall last-minute, we can see where there is space.’
Calibration
Koen Fleuren of Campus & Facilities sees other applications: ‘This software can contribute to the sustainability of the university’, he says. ‘By not constructing more buildings than necessary, or by not turning on the heating if no one is present in a particular wing of a building. Using this data, we can also adjust our cleaning programme: you can clean more often where it is busy and less where it is not busy.’
‘The occupancy figures for large lecture halls are already very accurate’
But the programme is not there yet, Fleuren continues. ‘If we want to draw conclusions, we need to be sure that the system is correct. At the moment, we are still calibrating the system. We do this by manually counting how many seats are occupied in a lecture hall, and comparing this with the figures coming from the software. The occupancy figures for large lecture halls are already very accurate, but we still need to refine the programme for the other buildings.’
Campus Plan
Will the results of these measurements also be used in the realisation of the Campus Plan? Will data on occupancy rates in the Erasmus building, for example, be useful to fine-tune the working environment in the new humanities building? ‘Nothing can be said about that yet’, say Fleuren and Hagels.
‘We try to use our facilities as sustainably as possible and we try to match them to needs as much as possible’, Fleuren said. ‘This package gives insight to say that there is space shortage somewhere, for example. With that information, we can, in discussion with the faculties and with the users of the buildings, see how we can spread the crowds better across buildings. But before that, we have to wait for the first analyses of our measurements.’
Eight buildings
Occupancy is measured in these eight buildings on campus via HubStar’s software: Elinor Ostrom building, Grotius building, Erasmus building, Spinoza building, Linnaeus building, Lecture hall complex, Huygens building and Maria Montessori building. Counting also takes place in some other buildings on campus. However, this is not done by HubStar’s software, but only via the campus-wide Wi-Fi network.
Translated by Jan Scholten.


